Insights
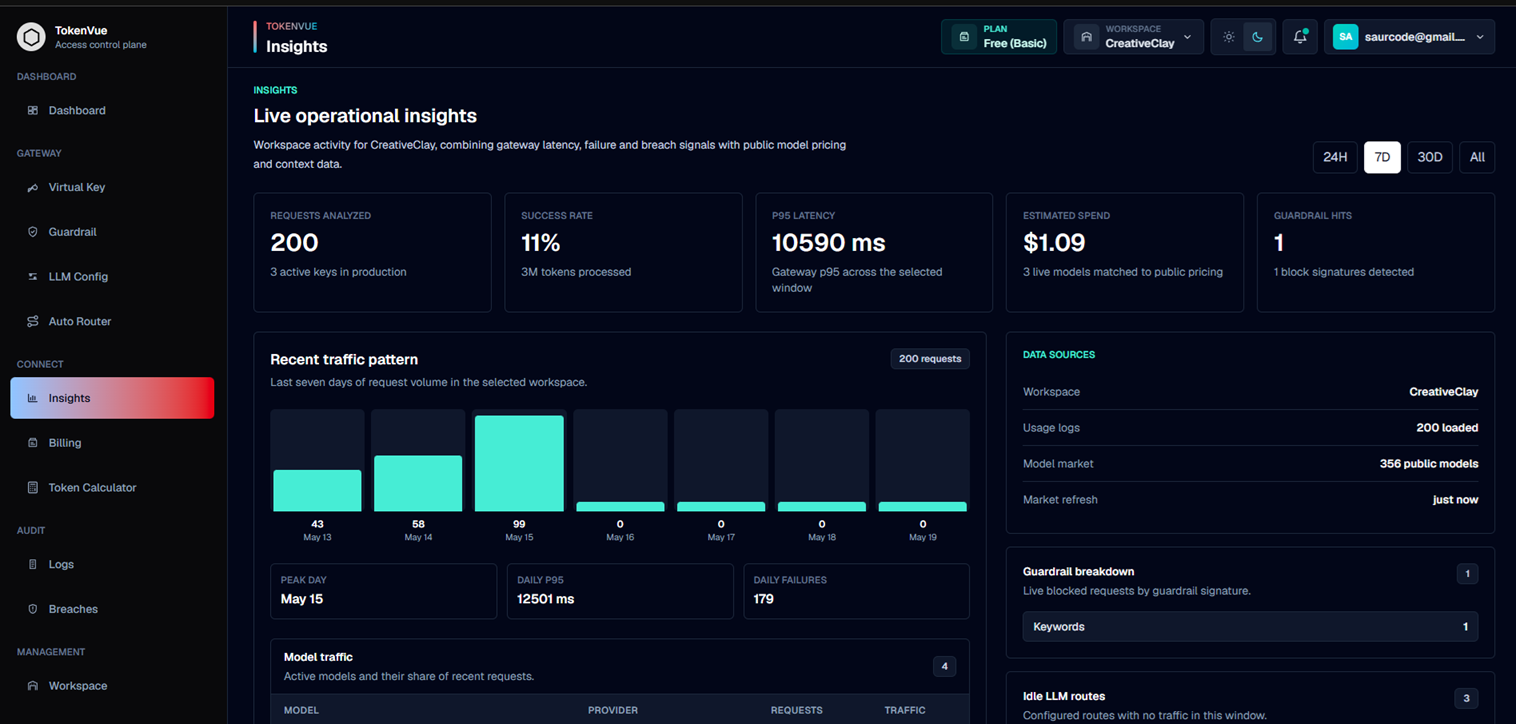
Insights in TokenVue show live operational signals from your workspace's LLM gateway traffic.
The Insights page combines TokenVue usage logs with public model market data so teams can understand request volume, token usage, latency, failures, guardrail activity, provider performance, and estimated model cost.
What Insights Shows
Insights helps teams understand how their LLM traffic is performing.
You can use it to review:
- Total requests
- Total tokens processed
- Estimated spend
- P95 latency
- Model traffic share
- Provider performance
- Guardrail blocks
- Service-level hotspots
- Idle LLM routes
- Public model pricing and context data
Data Sources
TokenVue Insights uses two main data sources:
| Source | Description |
|---|---|
| Workspace usage logs | Live request, token, latency, provider, model, status, and guardrail data from TokenVue traffic. |
| Public model market data | Public pricing and context information used to estimate spend and compare active models. |
If public market data is unavailable, local workspace insights still work, but pricing and context comparisons may be reduced.
Time Windows
Insights can be filtered by time window.
Available views include:
- 24H
- 7D
- 30D
- All
This helps teams compare recent activity against longer-term usage patterns.
Generated Insights
TokenVue generates operational insight cards from live gateway activity.
These cards can highlight:
- Latency hotspots
- Failure-heavy services
- Models driving the largest estimated spend
- Guardrail block patterns
- Idle configured routes
- Models that may be over-provisioned for current prompt sizes
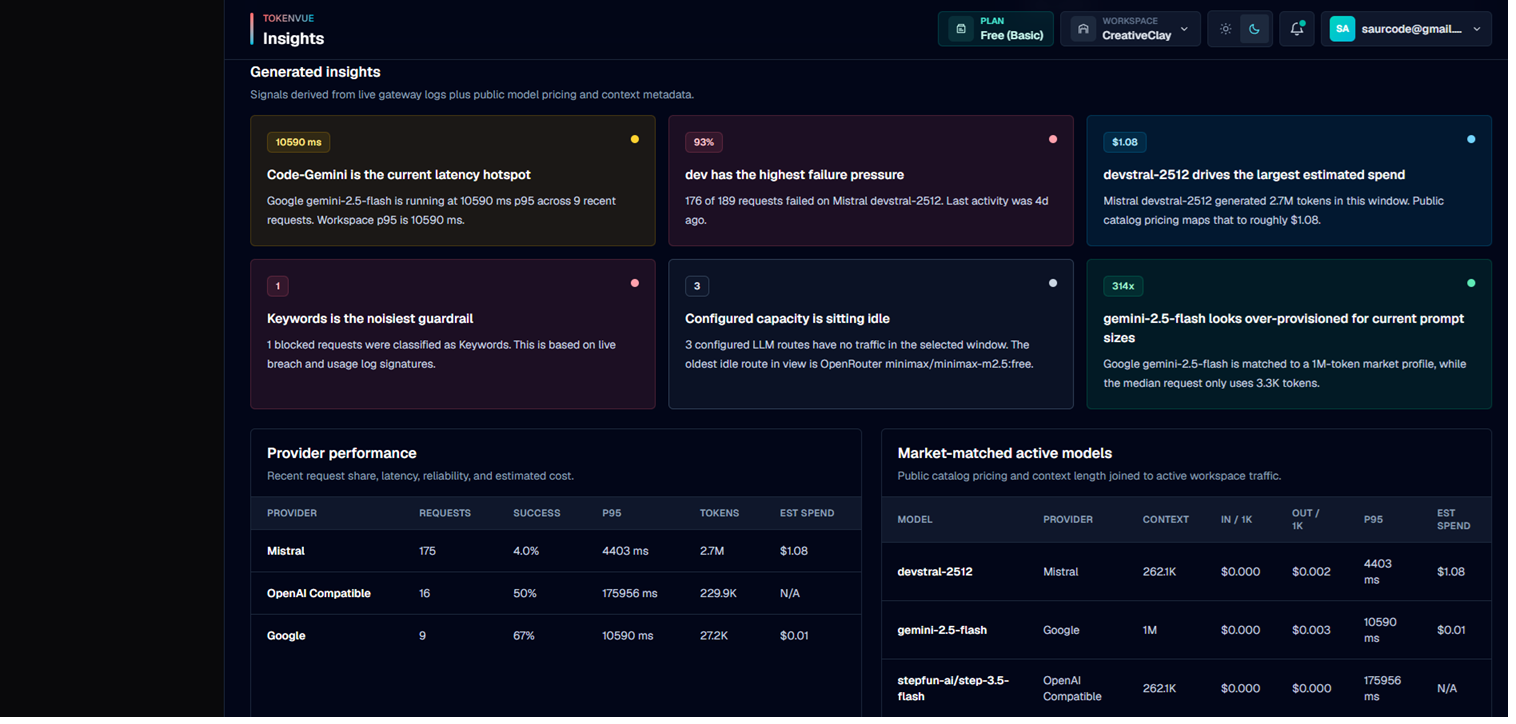
Provider Performance
The Provider Performance table shows how each provider is behaving in the selected time window.
It includes:
- Request count
- Success rate
- P95 latency
- Total tokens
- Estimated spend
This helps teams compare providers by reliability, speed, cost, and usage.
Market-Matched Active Models
TokenVue can match active workspace models against public model catalog data.
When a match is available, Insights can show:
- Context length
- Input cost per 1K tokens
- Output cost per 1K tokens
- P95 latency
- Estimated spend
This helps teams understand whether current model choices are cost-effective for actual usage.
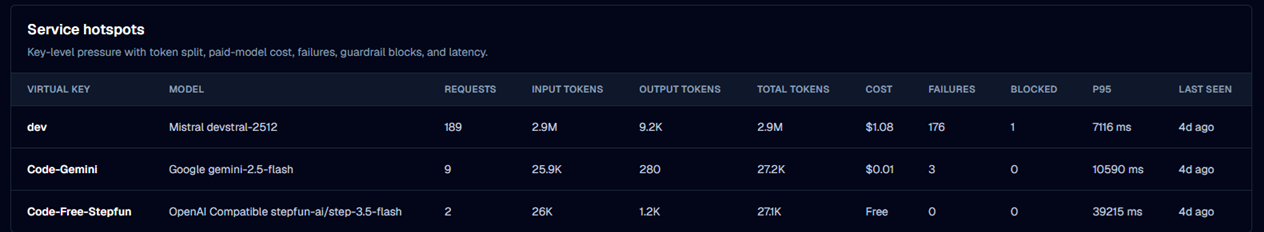
Service Hotspots
Service Hotspots show key-level pressure across virtual keys.
This view helps identify which services or workloads are responsible for the most traffic, cost, failures, blocks, or latency.
It includes:
- Virtual key
- Model
- Request count
- Input tokens
- Output tokens
- Total tokens
- Estimated cost
- Failures
- Blocked requests
- P95 latency
- Last seen time
Guardrail Breakdown
The Guardrail Breakdown section shows blocked requests grouped by detected guardrail signature.
Examples include:
- Hard Budget Cap
- PII Scrubbing
- Toxicity Filter
- Injection Detection
- Keywords
- Gateway Block
This helps teams understand which protections are being triggered most often.
Idle LLM Routes
Idle LLM Routes show configured provider/model routes that have no traffic in the selected time window.
This is useful for cleanup, cost reviews, and checking whether expected routes are actually being used.
Best Practices
- Review Insights after connecting production traffic.
- Use time windows to compare short-term issues with longer-term trends.
- Watch P95 latency instead of only average latency.
- Check Service Hotspots to find noisy or expensive virtual keys.
- Use Guardrail Breakdown to tune workspace policy.
- Review idle routes regularly to remove unused configurations.
- Compare estimated spend against provider billing for validation.
In Short
Insights is the analytics layer of TokenVue.
It helps teams understand how LLM traffic behaves across virtual keys, models, providers, costs, latency, failures, and guardrail activity.